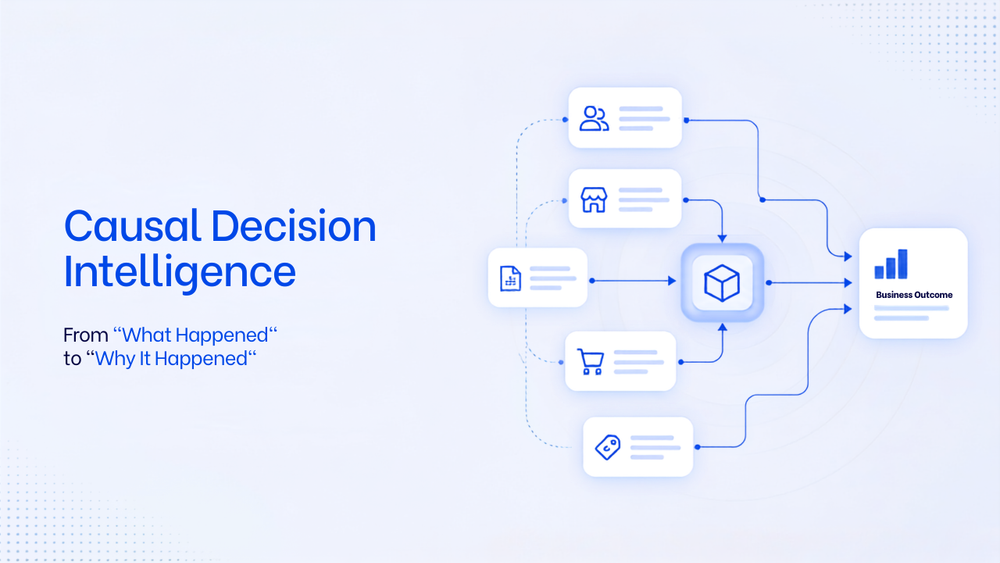
Quick answer: AI in business analytics means using machine learning, large language models and causal AI to analyse business data faster and more deeply than manual methods. It answers plain-language questions, spots anomalies, forecasts demand and cash, and explains why a metric changed. The biggest shift is from reporting what happened to explaining why.
Business analytics used to be a slow loop. A manager noticed a problem, asked an analyst, waited for an Excel file, asked a follow-up, and waited again. AI shortens that loop from days to minutes, and it also changes which questions people ask, because a question is no longer expensive.
Most companies have started. In McKinsey's 2026 State of AI survey of 1,719 organisations across 97 countries, nearly nine in ten respondents said they regularly use AI in at least one business function, but only 37% attributed any EBIT impact to it (McKinsey). Using AI is common. Getting decisions out of it is not. This guide shows how AI is changing business analytics by function, with worked examples of root cause analysis, the limits you should know about, and a practical way to start.
What is AI in business analytics?
Business analytics is the use of data to understand performance and make decisions. AI in business analytics, delivered through a business analytics platform with AI built in, adds four abilities that manual analysis struggles with:
- Scale. Scanning every region, SKU, customer and day for changes, not just the few a person thinks to check.
- Speed. Answering a new question in seconds by generating the query automatically.
- Pattern detection. Finding anomalies, segments and seasonality in large datasets.
- Explanation. Breaking a change into its drivers and separating real causes from coincidence.
Gartner calls this augmented analytics. For a general overview of what AI can and cannot do with data, see can AI do data analytics.
How AI is changing business analytics: before and after
| Task | Before AI | With AI |
|---|---|---|
| Asking a new question | Ticket to analyst, 1 to 5 days | Plain-language question, seconds |
| Monthly MIS | Analyst compiles Excel over 2 to 3 days | Generated and scheduled automatically |
| Spotting problems | Someone notices at the month-end review | Alert the day the metric moves |
| Finding the cause | Manual drill-down across many cuts | Automated driver and causal analysis |
| Forecasting | Last year plus a growth percentage | Models with seasonality and confidence ranges |
Worked example 1 (illustrative): why did revenue drop?
Situation. A consumer goods company's secondary sales in the East fell 12% month on month. The sales head suspects the new pricing.
Manual approach. An analyst cuts the data by state, distributor and SKU over two days. The pivot tables show declines almost everywhere, which does not point to one answer.
AI approach. Why did revenue drop? Analytics built on causal methods answers this directly. A causal AI analytics tool breaks the 12% drop into its drivers:
- 7 points came from fewer active outlets in two districts of West Bengal.
- 3 points came from a lower average order value on one pack size.
- 2 points were normal seasonal variation.
It then checks the outlets: most of the inactive ones were served by one distributor whose stock of the top SKU ran out mid-month. The pricing change had almost no effect.
Decision. Fix the distributor's stock and credit, not the price. Without the driver analysis, the company would likely have rolled back a price increase that was working.
Worked example 2 (illustrative): why are margins shrinking?
Situation. Gross margin fell from 34% to 31% over a quarter while revenue grew.
AI finding. The mix shifted toward a lower-margin channel (modern trade), discounts on slow-moving SKUs rose, and freight cost per unit climbed on one route. Causal analysis showed that the channel mix explained most of the decline.
Decision. Set a minimum margin rule for modern trade schemes and renegotiate the one freight route, instead of a blanket price rise.
8 use cases of AI in business analytics by function
1. Sales
Identify which distributors, outlets or reps drive changes in revenue, flag accounts at risk of churn, and forecast monthly sales by region. This is the core of FMCG analytics, and it applies equally to pharma and distribution businesses.
2. Finance
Automate MIS and board reports, track receivables ageing, predict late payers, and explain budget variances line by line. See can AI analyse financial statements.
3. Supply chain and operations
Forecast demand, predict stock-outs before they happen, and trace delivery delays to specific routes, warehouses or vendors.
4. Marketing
Compare channels on customer acquisition cost and return on ad spend, and separate the true effect of a campaign from seasonality.
5. E-commerce and D2C
Explain return spikes (product, size, courier or pin code), catch marketplace commission overcharges, and track repeat purchase rates. For Shopify stores, AI analytics tools built for Shopify connect to orders and returns directly and explain why sales moved, which native reports do not.
6. HR
Find the drivers of attrition by team, manager and tenure, and forecast hiring needs. For field-heavy businesses, link attrition to territory performance to see whether losing a rep also costs outlets.
7. Leadership
Get a weekly written summary of what changed and why, with business anomaly detection flagging anything outside its normal range.
8. Government and public sector
Government data analytics covers scheme delivery, procurement spend and service levels across districts, where data sits in many departmental systems. Plain-language questions and role-based access let officials see their own district's numbers without waiting for a central MIS cell.
Four stages of AI maturity in analytics
| Stage | What it looks like | Next step |
|---|---|---|
| 1. Manual | Excel MIS, analyst queue, month-end surprises | Connect source systems to one platform |
| 2. Assisted | Dashboards plus a chatbot for simple questions | Agree metric definitions so answers match the MIS |
| 3. Proactive | Alerts and forecasts reach owners without being asked | Add root cause analysis to every alert |
| 4. Decision-led | Every major decision starts from a tested cause and ends with a tracked result | Extend to more functions and scenario planning |
Most Indian mid-size companies sit at stage 1 or 2. The jump that pays off is from 2 to 3, where problems surface before the review meeting rather than during it.
Limits of AI in business analytics
- Data quality still decides accuracy. Duplicate customers and inconsistent product codes lead to wrong answers.
- Correlation is not causation. Many tools show what moved together. Only causal methods test whether one thing actually drove another.
- Context comes from people. AI can find that a distributor stopped ordering. A sales manager may know it is because of a local festival or a dispute.
- Governance matters. Access rules must carry over, so a regional manager does not see company-wide salary data.
Using AI for business analytics will not replace analysts. It removes the routine work so they can focus on harder problems. More on this in can AI replace data analysts.
How to start with AI in business analytics: 5 steps
- Pick one painful question that comes up every month, such as "why did collections fall?"
- Connect the source systems that answer it (Tally, ERP, CRM, DMS) directly, not through Excel exports.
- Agree metric definitions for the 10 to 15 numbers that matter most.
- Run the AI tool alongside your current MIS for a month and compare answers.
- Expand by function once leaders trust the numbers.
What to look for in an AI business analytics tool
| Capability | Question to ask in the demo |
|---|---|
| Direct connectors | Can it read Tally, our ERP and our CRM without a data warehouse project? |
| Plain-language questions | Can a regional manager get the right number without training? |
| Root cause analysis tool | When a metric drops, does it show the drivers and their size, or only the drop? |
| Metric definitions | Can we define net sales, DSO and active outlet once, for every answer? |
| Alerts | Does it tell the owner when a metric leaves its normal range? |
| Security | Does it apply row-level access and keep data in India if required? |
For a side-by-side view of tools, see the best BI tools in India.
How FireAI helps
FireAI is a causal decision intelligence platform built by Steeplogic Systems in India. It connects to 700+ data sources including Tally, SAP and Zoho, lets teams ask questions in 90+ languages, and uses Causal Chain analysis to trace every change to its root cause. Alerts, forecasting and scheduled CXO reports cover the rest of the analytics loop. Book a demo.
Related reading
- AI in business intelligence: from dashboards to causal answers
- Best BI tools in India (2026)
- Data-driven decision making: why you need the why
Sources
- McKinsey, The State of AI (survey fielded May to June 2026)